Rental Mismatch: Where Do Renters Struggle to Find the Amenities They Want

While working to match every renter with the right home, Apartment List gathers unique data on which amenities are most and least popular with renters, as well as which amenities are the easiest and hardest to find.
In-unit laundry is the hardest amenity to find, as it has the largest gap between renter demand and property-level availability. An estimated 53 percent of renters want in-unit laundry, but only 13 percent of properties have it. Meanwhile, pet-friendliness is the most oversupplied of the amenities we analyzed.
Renter preferences vary substantially by location. Renters in more affordable markets tend to have a higher demand for amenities, while renters in the priciest markets are more willing to settle for less.
We find that in most metros, there is an imbalance in the supply and demand for amenities, meaning that, in many cases, renters are likely to have difficulty finding what they want or to pay for amenities they don’t need.
Download Complete Data
Introduction
At Apartment List, our goal is to help renters find homes that they love by making the apartment hunting process as smooth and enjoyable as possible. To do so, we take the time to ask renters important questions about their preferences. The answers power the product's tailored search experience and provide us with unique insights into which amenities renters are seeking in their next home. In some cities, however, the types of amenities that renters desire may not match what is available in the marketplace. We dug into user preference data – as well as property-level data from the listings on our site – to see how well the amenities available in rental properties align with what renters want and how the supply and demand for amenities varies across the nation’s largest metros.1
53 percent of renters want in-unit laundry, but only 13 percent of properties have it
Analyzing data for ten of the most common amenities, we find that the amenities that renters desire most aren’t the same ones that properties are most likely to offer. Below, we compare the share of properties that have each amenity to the share of users that report a preference for that amenity. Use the drop-down menu to view local data for hundreds of cities and metropolitan areas across the country.
In-unit laundry is the most undersupplied of the amenities we looked at. An estimated 53 percent of renters say they’re looking for in-unit laundry, but it’s also the hardest amenity to find, available in only 13 percent of properties. Air conditioning and parking are similarly lacking. These are the two most desired amenities, with 56 percent of renters citing a preference for air conditioning, and 55 percent saying they want parking. Meanwhile, only 39 percent of properties have air conditioning and only 46 percent have parking. It’s also worth noting that even when parking is available, it often costs renters an additional fee. In some dense cities, such as New York and San Francisco, getting a parking spot could add hundreds of dollars to a renter’s monthly expenses.
At the other end of the spectrum, it seems that there are more pet-friendly apartments than there are renters who have pets. Cat-friendliness is the most common amenity on the property side, available in 52 percent of properties, but only 12 percent of renters are looking for a cat-friendly apartment, the smallest share of all the amenities we analyzed. Similarly, 48 percent of properties say that they are dog-friendly, but only 27 percent of users select this preference.
The relative lack or overabundance of particular amenities on the property side is likely related to the upfront costs associated with each amenity. For example, providing pet-friendliness doesn’t involve any upfront cost, only marginal incremental costs associated with faster wear and tear, which are often recouped by charging “pet rent.” On the other hand, in-unit laundry takes up valuable additional space within a rental unit, and also requires significant upfront costs, including purchasing the machines and arranging the plumbing.
San Antonio renters want it all, while in NYC, renters will take what they can get
As might be expected, renter preferences vary significantly across different parts of the county. The table below lists the metros with the highest and lowest shares of renters with a preference for each of the amenities we analyzed:
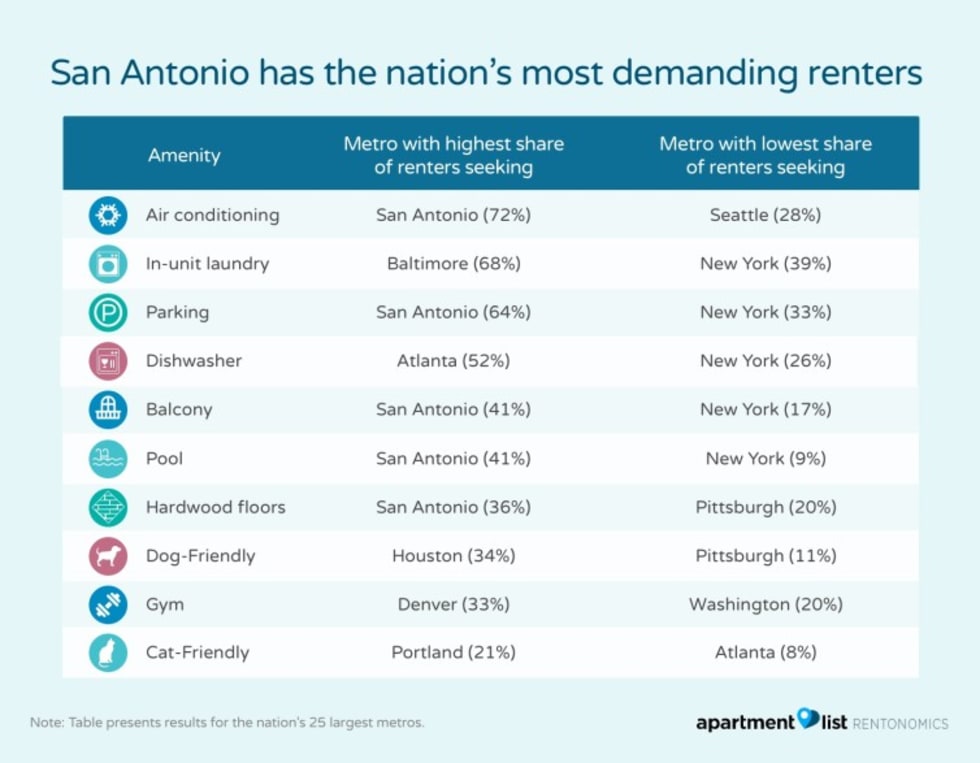
San Antonio dominates the list for highest amenity demand, with the greatest share of renters requesting five of the 10 amenities we analyzed. Given the Texas heat, it’s no surprise that so many San Antonio renters are looking for air conditioning and pools. San Antonio is also one of the nation’s most affordable large cities, with a median two-bedroom rent of $1,050, which may explain why the area’s renters are more willing to splurge on higher-end amenities, such as hardwoods floors and balconies.
In contrast, the New York City metro has some of the nation’s least choosy renters, with the metro accounting for half of the spots on the low demand list. New York is the nation’s second most expensive rental market -- trailing only San Francisco -- with a median two-bedroom rent of $2,470. It seems that renters in New York are willing to sacrifice the comfort of additional amenities in an effort to maintain some semblance of affordability.
This relationship between affordability and renter demand holds in other cities as well. In the expensive San Francisco and Boston markets, renter demand is below the national average for nine of the 10 amenities we analyzed, while renter demand exceeds the national average for nine of 10 amenities in the more affordable Tampa and Phoenix markets.
Most metros fall into three categories: (1) too many amenities, (2) not enough amenities, (3) the wrong amenities
Just as demand for amenities varies across markets, so does the supply of amenities on the property side. In order to see how well the supply and demand for amenities are aligned in different markets, we calculate an “Amenity Satisfaction Index” and an “Excessive Amenity Index” for each metro.
Our Amenity Satisfaction Index represents the likelihood that a renter will be able to find all of their desired amenities, while the Excessive Amenity Index represents the likelihood that a property will have additional amenities beyond what a renter wants. For both indexes, a value above zero indicates an above average likelihood, while a value below zero represents a below-average likelihood.
The scatter plot above charts our Amenity Satisfaction and Excessive Amenity Indexes against one another for the 70 metros for which we calculated these metrics. Each quadrant of the chart represents a distinct interaction between the supply and demand for amenities:
(1) In the upper-right quadrant are “amenity rich” metros. These are places where a renter has an above-average chance of finding all of their desired amenities, but also an above-average chance of ending up with amenities they don’t care about.
- While finding all of one’s preferred amenities is great, an overabundance of amenities can be bad for renters if they’re paying extra for amenities they don’t need.
- All of the major Texas metros (Houston, San Antonio, Dallas and Austin) fall in this quadrant, likely owing to the state’s abundant supply of new construction, which tends to be well-equipped with modern amenities.
- Some expensive metros, such as New York and Boston, fall into this category as well. These metros have less abundant supplies of amenities on the property side, but, as noted above, renters here also have less demanding preferences, likely owing to a lack of affordability.
(2) In the bottom-left quadrant are “amenity poor” metros, where renters have a below average chance of finding their desired amenities and are unlikely to end up with extra amenities
- In these metros, renters who want to splurge on additional amenities may have difficulty finding what they’re seeking.
- The set includes a number of rust-belt cities, such as Detroit, Indianapolis and Cleveland, which generally have older rental stocks compared to the amenity rich Texas metros.
(3) In the upper-left quadrant we have an “amenities mismatch”, where renters have a below average chance of finding the amenities they’re looking for, but an above average chance of ending up with amenities they don’t need.
- Metros here represent an interesting case in which properties are supplying plenty of amenities, but don’t seem to have a good grasp of what renters actually want.
- For example, in Madison, WI, the share of properties with gyms, hardwood floors and balconies is greater than the share of renters looking for them. Meanwhile, dishwashers, air conditioning and in-unit laundry are in short supply.
- Other metros offering the wrong amenities include Portland, Phoenix and Tucson.
(4) Finally, the bottom-right quadrant contains metros with a well-matched supply of amenities. This quadrant represents the best possible outcome -- renters are likely to find all the amenities they want and unlikely to have extra amenities they don’t need.
- Unfortunately for renters, only 10 of the 70 metros we analyzed fall into this section of the chart, and many of those fall very close to the bordering quadrants. Overall Providence, RI, has the best match.
- The scarcity of metros in this section of the chart indicates that it’s actually quite rare for a rental market to have a well balanced supply and demand for amenities. In most metros, renters are likely to have difficulty finding the amenities they’re looking for or end up paying for some amenities that they don’t need.
Conclusion
Amenities are one of the top factors that renters consider when searching for an apartment, and having access to all of one’s preferred amenities can make it a much easier decision to rent a home. That said, some amenities are easier to come by than others. Our analysis indicates that in-unit laundry is the holy grail of amenities. Most renters want it, but very few properties have it.
The level of emphasis that renters place on finding amenities also varies substantially by location. Renters in more affordable markets tend to have a higher demand for amenities, while renters in the priciest markets are more willing to wash dishes by hand or haul dirty clothes to the laundromat.
Overall, we find that many markets do a poor job of matching amenity supply and amenity demand. Renters in 59 of the 70 metros we analyzed are likely to have difficulty finding all the amenities they want, be paying for amenities they don’t need, or, in the worst cases, both lack the amenities they want and pay for those they don’t. As our nation’s rental stock continues to grow, we hope that developers, property managers and landlords will consider which amenities are most desired in their markets in order to bridge the gap between amenity supply and amenity demand.
Download Complete Data
Methodology
Property-level amenity data is taken from the listings on our platform. Renter preference data is gathered through the Apartment List registration quiz. We analyze data for users who registered between June 1 and December 31, 2017, filtering out responses for users who did not specify amenity preferences. User locations are identified by the primary location in which the renter is searching, which may differ from the location in which the user currently resides.
Our Amenity Satisfaction and Excessive Amenity Indexes are calculated based on a monte carlo simulation in which we repeatedly match randomly selected users with randomly selected properties within each metro. The Amenity Satisfaction Index represents the probability that a randomly selected property has all the preferred amenities of a randomly selected user. The Excessive Amenity Index represents the probability that a randomly selected property has additional amenities beyond the preferences of a randomly selected user. Both indexes are normalized to a mean of zero and standard deviation of 1. These indexes are calculated only for metros with a minimum sample of 500 on both the user and property sides, and a minimum of 65,000 renter-property pairs are drawn in the monte carlo simulation.
For any questions, don’t hesitate to contact us at rentonomics@apartmentlist.com.
- All results below are based on registered Apartment List users and properties who list on our platform. These samples may not be fully representative of the overall rental market.↩
Share this Article